HR Data Analytics Dashboard
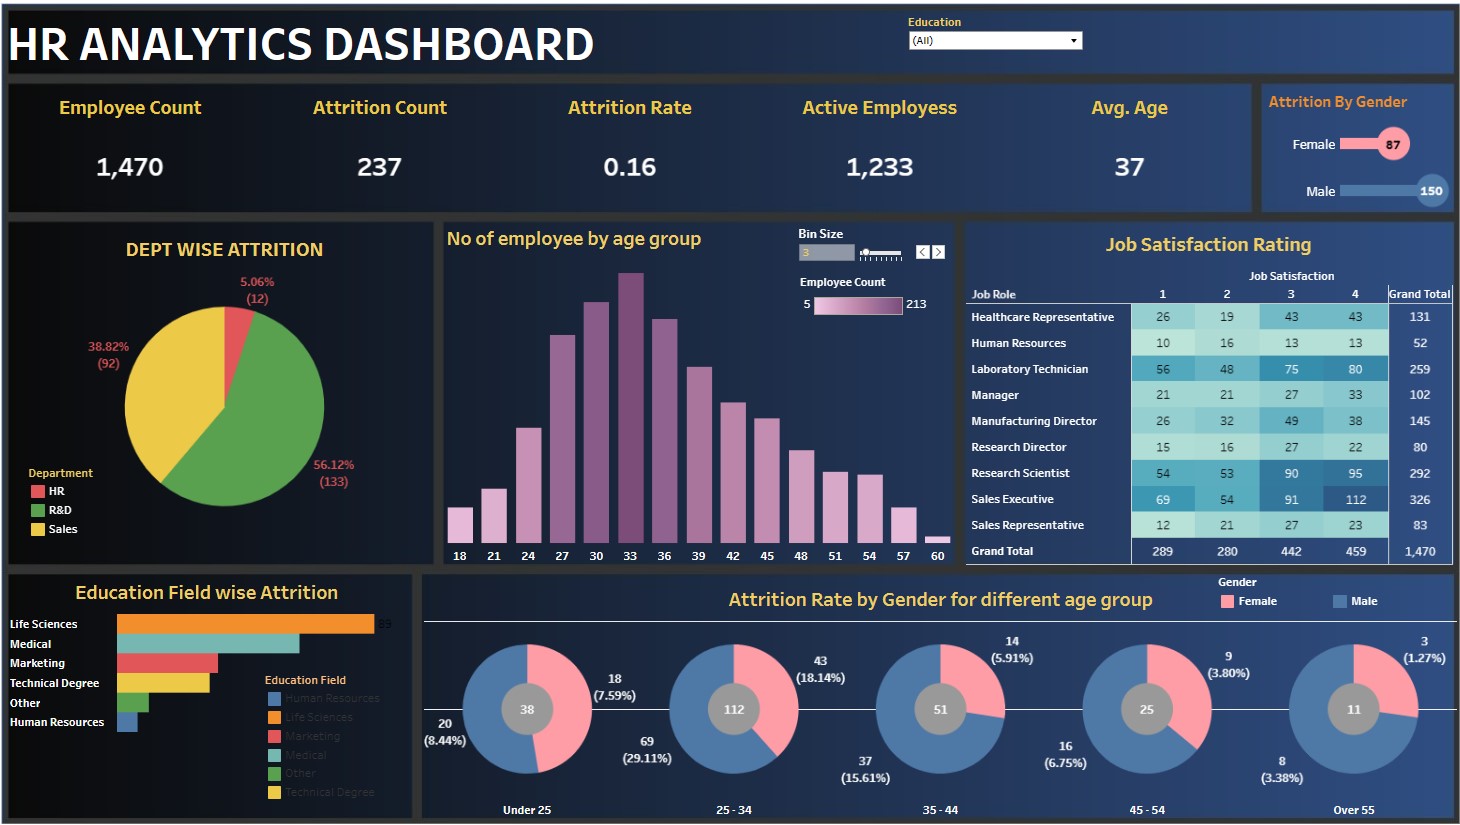
In this Tableau HR Analytics Dashboard project, I analysed approximately 1,500 employee records to determine how many employees departed the organisation based on their job title. In addition, whenever you select an option from the top slicer, it will automatically display the total number of employees in the selected department, as well as their attrition count, attrition rate, active employees, age, and attrition by gender. All of these are KPI, and they will change iteratively. In addition to utilising a pie chart, I have attempted to illustrate the attrition by department using a bar diagram with three different colours and the number of employees by age group. I have utilised a matrix to display job satisfaction ratings, displaying the grand total per department. In the final section of the dashboard, I used a second bar diagram to depict attrition by education field and a donut chart to illustrate attrition rates by gender and age group. ThankYou